How to produce stand-out ABM results with Intent data benchmarking
The view from the summit is less impressive if you can’t see how big the mountain is.
…and the same goes when it comes to Intent data.
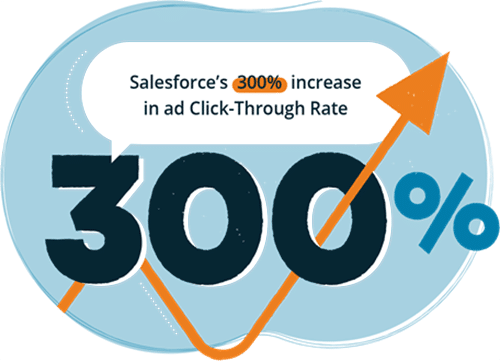
Sure, showing results like Salesforce’s 300% increase in ad Click-Through Rate is impressive, but you just can’t show those kinds of stats if you don’t have a clear picture of where you’ve come from.
“Half my advertising spend is wasted; the trouble is, I don’t know which half.”
Until recently, businesses had limited advertising channels that were hard to measure (How do you really measure the effectiveness of a TV commercial, billboard, or radio ad?), but oh, how times have changed.
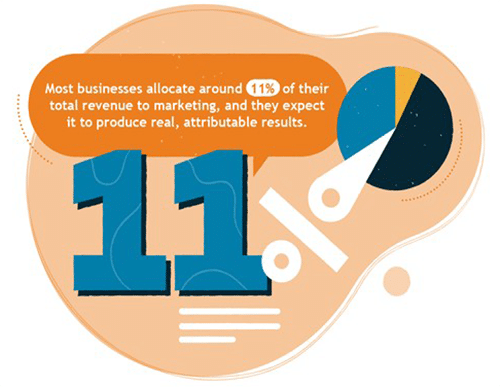
Today, most businesses allocate around 11% of their total revenue to marketing, and they expect it to produce real, attributable results.
Measure to manage
Showing the value and ROI of your efforts is critical to setting realistic and attainable goals, proving your value within your business, and advocating for and justifying additional budget, and establishing benchmarks for your Intent data strategy will ensure you can:
- Show improved efficiency and effectiveness in generating sales-qualified leads
- Quantify increased contribution to sales pipeline
- Measure the acceleration of the entire sales cycle, and
- Validate your investment in Intent data
Intent data can dramatically change the way you approach marketing – driving efficiency across your entire pipeline from targeting and top of funnel to closed-won to customer expansion and retention.
With established benchmarks, you can pinpoint when Intent data has moved the needle and more thoroughly evaluate the success of Intent-driven marketing efforts.
How much ya’ bench?
So, if you’re in the early stages of tracking benchmarks and feel overwhelmed, have no fear! We assembled this guide to show our 8 favorite metrics to gather before getting started with Intent data!
What is Intent data again?
Intent data tells you when buyers are actively researching online for a solution, and which products and services they are interested in, based on the web content they consume.
It’s an essential ingredient for creating a complete picture of the buyer, including what they care about, how they want to get information, and what would convince them to buy, and it helps your team reach out at the perfect time with the content and product offers your customer is looking for.
Whether you want to use Intent data to prioritize sales leads, launch an account-based marketing campaign, create relevant content, or supplement existing lead or account scoring models, this guide will give you a starting point for making Intent data work for you.
Benchmark 1: Full funnel velocity
Track conversion rates across your funnel – from Inquiry to Marketing Qualified Lead (MQL) to Sales Accepted Lead (SAL) to Sales Qualified Lead (SQL)
Simply put, measure how your lead quality improves over time.
- How quickly did the leads captured and nurtured without Intent data convert through each stage in the marketing funnel?
- Do Intent-driven leads take less effort to nurture and qualify?
Understanding the lifecycle of your leads is half the battle – to calculate lead generation benchmarks, you’ll need to look at every stage of the funnel.
Here’s how to do it:
Inquiry to MQL: How many Inquiries turn into MQLs?
An inquiry is typically defined as a lead that fills out a form on your website or provides you with their contact information. Usually, this type of lead is taken through a sequence of nurture emails and other touchpoints to qualify them before handing them off to sales to become a Marketing Qualified Lead (MQL).
These emails and touchpoints align to a lead scoring methodology, which assigns points to the lead based on his or her actions and when the lead has accumulated enough points, it becomes an MQL. (You should always be sure your sales team agrees with what qualifies as an MQL and how quickly to follow up when marketing passes an MQL to an Inside Sales Representative (ISR)).
To get your benchmark, simply measure how many of your inquiries turn into MQLs over a specific period.
| Calculation: | Timeframe: |
|---|---|
| MQLs from a set period/Inquiries over the same set period | Monitor your lead conversion over the last four quarters and measure each quarter’s benchmark conversion rate |
MQL to SAL: How many MQLs turn into SALs?
A Sales Accepted Lead (SAL) is created when an ISR secures a meeting for sales or further qualifies an MQL.
So, how many of your MQLs agree to speak with sales and convert to a sales accepted lead (SAL)?
*To be most accurate, break this metric into different categories:
- SALs generated from MQLs set a benchmark for marketing efforts,
- SALs created when the ISR team generates leads on their own from cold calls and emails don’t.
See how your marketing-generated leads compared to the leads the ISR team generates.
| Calculation: | Timeframe: |
|---|---|
| SALs generated from marketing from a set period/MQLs over the same set period | Monitor conversion over the last four quarters and measure each quarter’s benchmark conversion rate |
SAL to SQL: How many SALs turn into SQLs?
Sales determine a Sales Qualified Lead (SQL) using a set of criteria that make the lead a good fit to move forward in the sales process, including available budget, buying authority, need for a solution, and timeline to make a purchase (BANT).
So, after the ISR team evaluates these leads, how many become an active opportunity or sales-qualified lead (SQL)?
*Again, separate your metrics into categories based on SQL source (Marketing, ISR/SDR, Sales, etc.) in addition to the overall conversion rate.
For this benchmark, answer three questions:
- How many of my marketing-generated SALs turn into SQLs?
- How many ISR-generated SALs turn into SQLs?
- What is the overall conversion rate for SAL to SQLs?
| Calculation: | Timeframe: |
|---|---|
| SQLs generated from marketing from a set period/SALs from the same set period | Monitor conversion over the last four quarters and measure each quarter’s benchmark conversion rate |
Benchmark 2: Cost of customer acquisition
How much does it cost to acquire a meeting, an opportunity, and a customer?
The cost to acquire a customer (Customer Acquisition Cost, or CAC) is an incredibly important metric to monitor, as marketing programs designed to increase awareness and acquire customers make up a significant portion of the overall marketing budget.
Companies can quickly find themselves upside-down if their Customer Acquisition Cost (CAC) exceeds their Customers’ Lifetime Value (CLV/LTV), but, even if it’s not as extreme as that, examining customer acquisition cost (CAC) helps marketing teams understand the entire cost of the customer journey and how or what to optimize.
Understanding your CAC can even help you determine if the projected revenue would offset the expense to acquire a new customer segment.
An easy way to benchmark acquisition costs is to take your total program spend from the previous year and divide that by the SALs, SQLs, and wins or new customers.
This gives you a baseline of how much it costs on average to acquire leads or customers with program dollars. The same can be done for MQLs, etc.
| Calculation: | Timeframe: |
|---|---|
| Total marketing spend on customer segment/Total sales from the customer segment | Get as specific as you want by only looking at leads generated and closed within a year, or vary it based on sales cycle time, etc. (We’ve found that taking a one-year span is often a very good start.) |
Benchmark 3: Breadth of contact data
Number of accounts targeted in your CRM system
Expanding your Total Addressable Market (TAM) gives you a much better chance of reaching the right prospects and generating enough leads to reach your revenue goals.
Using Intent data helps you grow your TAM by alerting you to new accounts that are showing interest in your Intent topics – Accounts that may never have been identified by sales efforts alone.
To understand the quantitative influence of Intent data on the size of your target account list, it’s important to examine how many accounts you currently have loaded and the frequency at which accounts are added or removed from your CRM, and the process for doing so.
- How many new accounts are added to the CRM each month?
- How many of these accounts come from marketing’s lead generation activities?
| Calculation: | Timeframe: |
|---|---|
| Create contact attribution reports in your CRM to keep track of contacts generated from marketing activities. Assign a set of rules and roles among sales and marketing teams for adding, cleaning, and deleting records regularly to instill the habit. | Depending on the volume of generated contacts, this could be a quarterly, monthly or even weekly review process. (Most marketers find that a weekly or monthly clean up works best). |
Benchmark 4: Website conversion rate
Compare web traffic to form fills
The main goal of your website is to generate leads and interest in your products or services.
…so how effective is it?
Every month, visitors from different sources, such as SEO, advertising, social media, etc. land on your website. How many fill out a form to ask for a piece of content or more information?
Monitoring website conversions helps you understand if your website traffic quality improves when publishing content and deploying Intent-based campaigns, and identifies weaknesses in the product messaging, web copy, or visitor journey.
When targeting prospects already researching your products and services with Intent data, website conversion rates should increase.
Here’s how to measure if Intent data is making an improvement in your website conversion rate:
| Calculation: | Timeframe: |
|---|---|
| Total number of form conversions over a set period/Total unique website traffic over the same period. | Look at this over the last year and measure each month’s benchmark. Measure every month to help identify and normalize any business seasonality. |
Benchmark 5: Appointment setting rate
Count the number of meetings set by ISRs per month
Integrating Intent data typically results in substantial increases in lead volume.
In order to prevent a warm lead from going cold- or completely losing them to a competitor – you may need to increase the capacity or headcount of your ISR team to ensure you can follow up with your leads fast enough.
Spend time understanding the capacity and historical output of your ISR team, then examine your targets and conversion rates, and align those with ISR team capacity.
Having an ISR team ready to support the increase in lead volume from Intent-driven campaigns is critical to success, so use this benchmark to advocate for more ISRs to support your desired go-to-market motions.
| Calculation: | Timeframe: |
|---|---|
| Total number of meetings or SALs generated by the ISR team for a set period/Number of ISRs active during that time | Look at this over the last year and measure each month’s benchmark and do this every month. |
Benchmark 6: Sales velocity
Compare the average duration of all stages in the sales pipeline from SAL to closed-won.
You should close deals faster when you use Intent data because you’re focused on prospects who are already in-market for your product or service.
One way to demonstrate that Intent data is working to speed up your sales velocity is to track how fast opportunities generated with Intent data pass through each stage of the sales cycle compared to opportunities generated without.
The best way to get this data is to partner with your CRM administrator to understand the average time a deal sits in a particular stage of the funnel and the average conversion rate from stage to stage. You can then use this data to calculate the total average sales cycle by adding up the duration of every stage and the overall win rate.
In addition to showing the benefits of Intent data, you can use this study to partner with sales to identify friction points in the buyer’s journey and develop content and strategies to remove resistance.
*If you’re noticing deals aren’t closing even though you’ve provided the sales team with higher-quality leads, examine other roadblocks in the sales process. For example, the sales team needs more training, or the pricing strategy is not competitive with the market.
| Calculation: | Timeframe: |
|---|---|
| Total number of SALs over a set period/Total wins over the same period | Look at this benchmark on a quarterly and annual basis |
Benchmark 7: Churn Rate
Divide the number of customers lost last quarter by the number of customers at the beginning of the quarter
Churn happens when a customer decides to end or stop renewing their contract, and it’s a big deal.
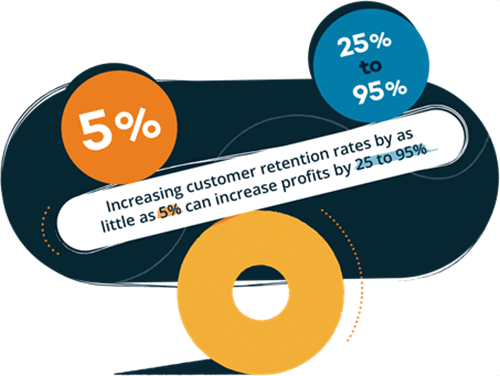
According to studies cited by Harvard Business Review, retaining your existing customers can be anywhere from 5 to 25% less expensive than trying to attract new customers, and increasing customer retention rates by as little as 5% can increase profits by 25 to 95%.
No matter what you do, you can’t completely eliminate customer churn, but, by using Intent data to pinpoint when customers might be considering other solutions or competitors, you can pass an early warning indicator to alert your account managers to proactively reach out and prevent this customer churn.
Calculating churn requires partnering with your sales and finance teams to understand how your business defines churn, and then meeting with your CRM administrator to understand how to classify and track business churn in the CRM.
| Calculation: | Timeframe: |
|---|---|
| Total number of customers terminating per time interval/Total number of customers at the beginning of the interval | Look at this over a longer time frame. Quarterly churn identifies overarching customer trends, while annual churn better assesses year-over-year performance. |
Benchmark 8: Cross-sell and upsell conversion
Determine how much revenue is generated from customers upgrading or buying more products/services
As we learned in Benchmark 7, keeping your existing customers happy saves you money and increases your revenue. A couple of other beneficial tactics to use with existing customers is cross-selling and upselling.
Similar to reducing churn, using Intent data to identify when customers show interest in other products or solutions that you offer allows you to launch a cross-sell campaign to inform or remind them of the other products available in your portfolio and highlight the benefits of purchasing them from a single provider.
*When implementing this strategy, make sure to frequently monitor the Intent of your customer base to make sure you stay timely and relevant.
Cross-sell and upsell conversion metrics can be tricky to measure, but a couple of measurement options include calculating the sales volume over a specified time or calculating the percentage of customers who are using more than one product (also known as an attach rate).
| Calculation: | Timeframe: |
|---|---|
| (Total number of secondary products sold/Total number of primary products sold) X 100 | Partner with your account managers to understand their sales targets and metrics, and the frequency at which they are selling new products to customers. This provides a benchmark for the types of products customers buy and how often they buy them. |
“If you don’t know where you’ve come from, you don’t know where you’re going.” – Maya Angelou
It can be tempting to jump in and start implementing Intent data right away, but, as with most things, a little time and preparation ensure better results in the end.
Launching into Intent-based marketing and sales activities without first taking good baselines will make it nearly impossible to produce those head-turning results that help you prove your value and justify the additional budget you’ll need to be successful in the future.
All of Bombora’s most successful customers started by gathering benchmarks, mapping out quick wins, and tracking progress incrementally along the way. This not only helps avoid data paralysis but also builds momentum and confidence.
To produce results that really influence growth in your ABM pipeline you need to first establish your benchmarks and we’d be happy to help you get on your path to ABM success.


